Debugging Improvements

I was wondering if any "improvements" are to be expected in the debug-mode from the PLC-next engineer?
Coming from some other editors, I find plcnext-engineer a relief to work with.
The only thing that bothers me is, that debugging is sometimes very difficult.
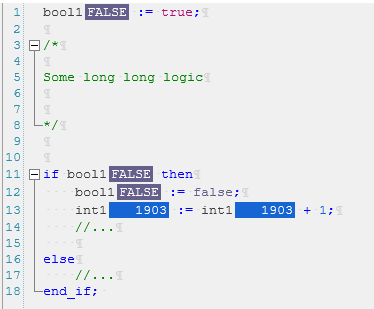
See the example below. Even in this simple example, it is not so easy to tell what path has been taken in the if/else statement. If "bool1" was not hardcoded, but e.g. a HMI bit that is set "true" once and then cleared up, there is no way to tell if lines 12-15 have been executed.
It is my experience that bugs mostly arise from a small implementation error, where the reasoning in itself was correct. The debugger makes it very difficult to find these kinds of errors, because in essence it is just the FB watch-table that is mapped back in-code (after execution-cycle) , rather than a true visual of the path that was taken.
Comments
Hi jv403,
maybe the extended debug options (especially execution time indication) are the "improvements" you are looking for. You can enable them in the Cockpit of the PLC instance.
Cheers
DivisionByZero
In addition to the suggestion from DivisionByZero, you could also try setting a breakpoint and then stepping through the code from there.
Dear @DivisionByZero ,
Many thanks, this was exactly what I was looking for.
I was unaware of the option and was searching in the plc-next-engineer settings rather than the plc-settings. It does however makes sense this is a plc/project-setting as it could delay code execution.
@Martin PLCnext Team , also thanks for the addition.
I knew about this option, which can indeed be a great help in development phase. But as we're dealing with machines & processes, I have some caution with suspending cyclic logic.
From Bachmann PLCs, there is an option in the "online debugging view" in Solution Center which makes the background of executed code lines in green while those not executed are red.
This is extremely useful as you can see at first glance which IF/ELSIF/ELSE statement is being executed and which CASE are active and so forth.
I miss the feature in PLCnext engineer
@fluxmodel , see the black stripes in my last screenshot. This shows the path that has been taken.
(Actually I think it marks variable-positions that have been read and/or written, I still have to discover this mode, but I think it shows something similar. Though indeed in a less visual way)
The black stripes are your markup, right? I initially thought that those marks were some kind of subtile way for the editor to show the execution process.
As far as I understand, one has to enable debugging mode and set breakpoints to really understand which parts of the code is being executed or not. In the lab, that is no problem - but in a production PLC or for special processes it is simply not possible to do in a safe manner.
In those cases, one has to edit the code with debug-variables to see what is being executed. Which again prompts the PLC to be reloaded and possibly stopped.
Below is a screenshot showing the debug mode when stepped into a case statement, it shows the currently active breakpoint with yellow background, and one has to set a lot of breakpoints to follow the execution process.
Feel free to enlighten me if I have missed something, i have only worked with PLCnext Engineer for a few months.
Hi fluxmodel,
the black stripes indicate the execution of a line of code when the option execution time indication is selected in the cockpit and the POU is selected in the debug options window.
You can activate the mode via a toolbar button in the instance editor:
This is what it looks like in my test project:
Cheers
DivisionByZero
Thanks, i got it.
Quite confusing the first time I am trying it.
Some code is executed, some is not - while not obvious why, as everything executes just fine when running normal debug mode.
Need to read the help file further.